Object detection from fMRI
In [1]:
from scipy.linalg import solve
from scipy.special import erf
import numpy as np
import pandas as pd
import os, pickle
import matplotlib.pyplot as plt
import multiprocessing as mp
import sklearn
from sklearn.metrics import auc
%matplotlib inline

data_dir = '../../../data/vim2/'
subject = 1
lag = 1
n_voxels = 100
train_frac = 0.8
In [2]:
with open(os.path.join(data_dir, 'st_objects_py2.pkl'), 'rb') as f:
    objects = pickle.load(f)
n_frames = len(objects)

unique_objects = np.unique([k for d in objects for k in d])
n_unique_objects = len(unique_objects)

object_index = dict(zip(unique_objects, range(n_unique_objects)))

confidence = np.zeros((n_unique_objects, n_frames))
for frame, d in enumerate(objects):
    for o, c in d.iteritems():
        confidence[object_index[o], frame] = c
confidence = np.stack([sec.mean(1) for sec in np.split(confidence, n_frames / 15, axis=1)]).T
confidence = np.roll(confidence, lag)[:, lag:]
confidence_barcode = ~np.isclose(confidence, 0)

order = np.argsort(confidence_barcode.sum(1))[::-1]
confidence = confidence[order]
confidence_barcode = confidence_barcode[order]
unique_objects = unique_objects[order]
object_index = dict(zip(unique_objects, range(n_unique_objects)))
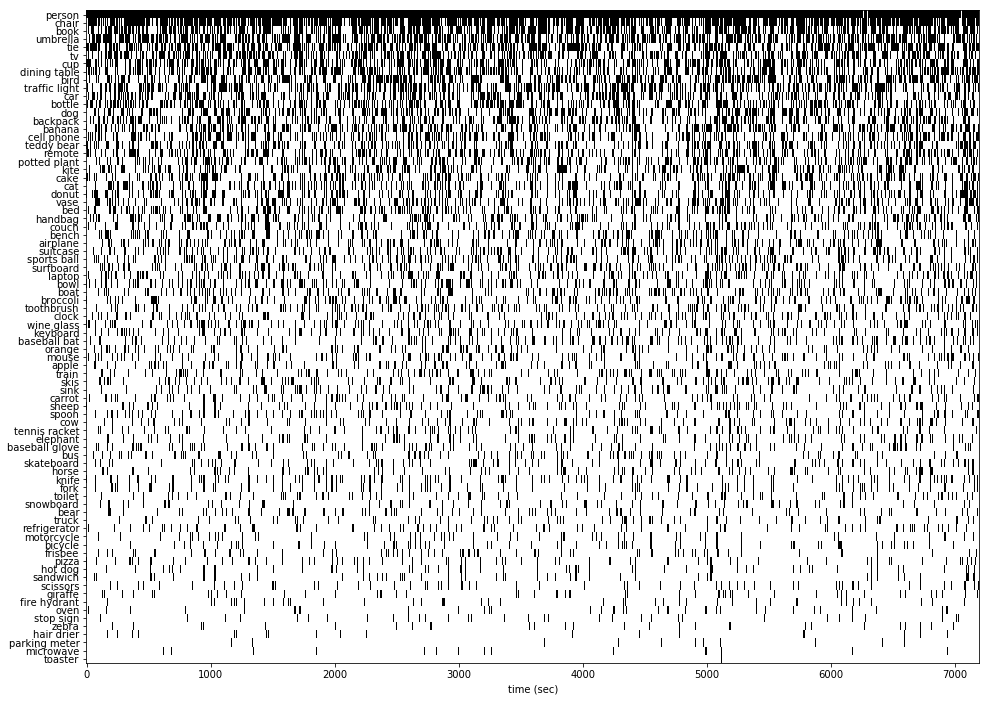
In [3]:
fig = plt.figure(figsize=(16,12))
ax = plt.gca()
ax.imshow(confidence_barcode, cmap='Greys', aspect='auto')
ax.set_yticks(range(n_unique_objects))
ax.set_yticklabels(unique_objects)
ax.set_xlabel('time (sec)')
plt.show()
In [4]:
voxels = np.load(os.path.join(data_dir, 'subject_%i' % (subject, ), 'rt.npy'))[:, lag:]
active_voxels = np.empty((n_unique_objects, n_voxels), dtype=int)
for o, i in object_index.iteritems():
    active_voxels[i] = np.abs(voxels[:, confidence_barcode[i]]).sum(1).argsort()[-n_voxels:][::-1]
In [5]:
n_seconds = confidence.shape[1]
t = np.arange(n_seconds)
split = int(n_seconds * train_frac)
t_train, t_test = t[:split], t[split:]
l = float(len(t_train)-1)
t_train1, t_train2 = t_train[:-1], t_train[1:]
t_test1, t_test2 = t_test[:-1], t_test[1:]

def fit(i, iters=500, atol=1e-8):

    x = voxels[active_voxels[i]]
    y = confidence[i] - confidence[i].mean()
    x_train = x[:, t_train]
    x_train1, x_test1 = x[:,t_train1], x[:,t_test1]

    s = np.sign(np.diff(y[t_train]))
    c = np.cov(x_train)
    x0 = (x_train1 - x_train.mean(1)[:, np.newaxis]) / l

    w = np.zeros(n_voxels)
    w[0] = 1

    erf_last = np.inf
    e = []

    for it in range(iters):

        h = w.dot(x_train1)

        erf_next = erf(h)
        ei = np.linalg.norm(erf_next - erf_last)
        e.append(ei)
        if ei * ei < atol:
            break
        erf_last = erf_next.copy()

        h *= s / erf_next

        w = solve(c, x0.dot(h))

    w /= np.sqrt(2)

    return w, e
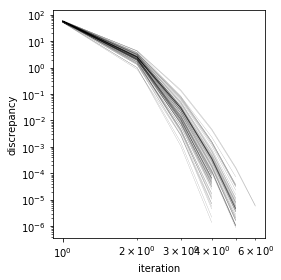
In [6]:
pool = mp.Pool(processes=mp.cpu_count())
res = pool.map(fit, range(n_unique_objects))
pool.close()
pool.terminate()
pool.join()

w = np.vstack([r[0] for r in res])
e = [r[1] for r in res]

fig, ax = plt.subplots(1, 1, figsize=(4,4))
for ei in e:
    ax.plot(ei, 'k-', lw=0.1)
ax.set_xscale('log')
ax.set_yscale('log')
ax.set_xlabel('iteration')
ax.set_ylabel('discrepancy')
plt.tight_layout()
plt.show()
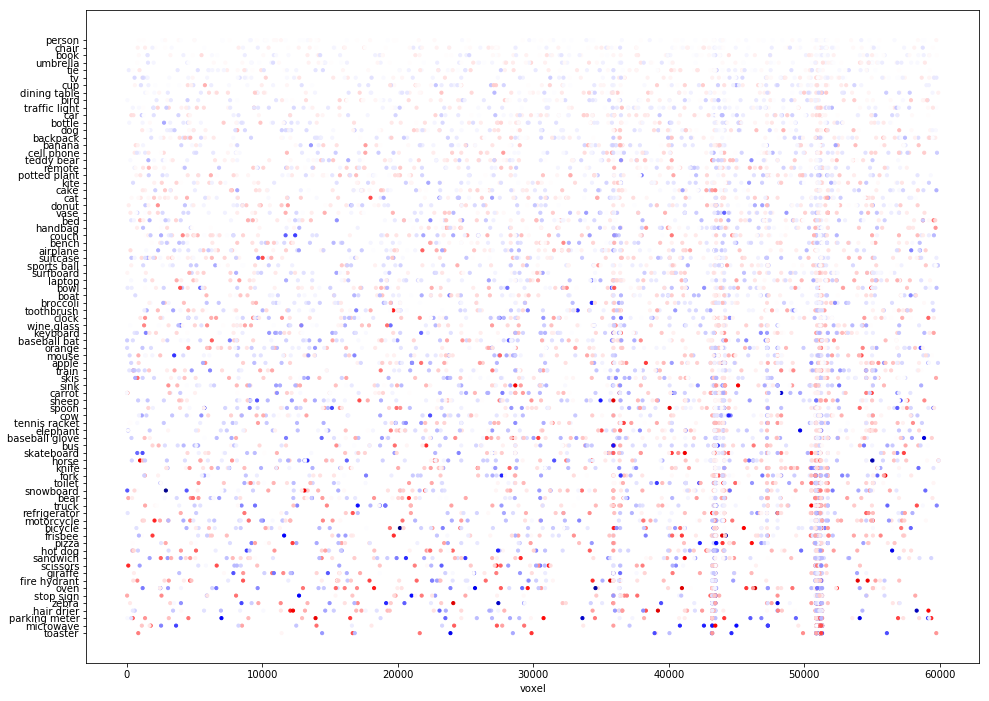
In [7]:
fig = plt.figure(figsize=(16,12))
ax = plt.gca()
i = np.repeat(range(n_unique_objects), n_voxels).flatten()
s = 10 +  w.min() + w.flatten()
c = w.flatten()
scale = np.abs(w).max()
ax.scatter(active_voxels.T.flatten(), i, c=c, s=s, cmap='seismic', vmin=-scale, vmax=scale)
ax.set_yticks(range(n_unique_objects)[::-1])
ax.set_yticklabels(unique_objects)
ax.set_xlabel('voxel')
plt.show()
In [8]:
train_prediction = np.empty((n_unique_objects, len(t_train2)))
test_prediction = np.empty((n_unique_objects, len(t_test2)))

for i in range(n_unique_objects):
    train_prediction[i] = confidence[i, t_train1] + w[i].dot(voxels[np.ix_(active_voxels[i],t_train1)])
    test_prediction[i] = confidence[i, t_test1] + w[i].dot(voxels[np.ix_(active_voxels[i],t_test1)])

    train_prediction[i][train_prediction[i] < 0] = 0
    test_prediction[i][test_prediction[i] < 0] = 0
    train_prediction[i][train_prediction[i] > 1] = 1
    test_prediction[i][test_prediction[i] > 1] = 1

fig, ax = plt.subplots(n_unique_objects, 1, figsize=(14, 2*n_unique_objects))
for o, i in object_index.iteritems():
    ax[i].plot(t_train2, train_prediction[i], 'b-',
               t_test2, test_prediction[i], 'r-',
               t, confidence[i], 'k-', clip_on=False)
    ax[i].set_ylim(0,1)
    ax[i].text(0, 0.95, o, ha='left', va='top', color='g')
plt.show()

In [9]:
def roc(true, prediction, n_threshold=500):

    tpr, fpr = np.empty(n_threshold), np.empty(n_threshold)
    positives, negatives = float(true.sum()), float((~true).sum())

    min_thr = min(true.min(), prediction.min())
    max_thr = max(true.max(), prediction.max())

    for i, thr in enumerate(np.linspace(min_thr, max_thr, n_threshold)):

        predicted_true = prediction >= thr

        tp, fp = true & predicted_true, ~true & predicted_true
        tn, fn = ~true & ~predicted_true, true & ~predicted_true

        tpr[i], fpr[i] = tp.sum(), fp.sum()
        if positives:
            tpr[i] /= positives
        if negatives:
            fpr[i] /= negatives

    return fpr, tpr, auc(fpr, tpr)
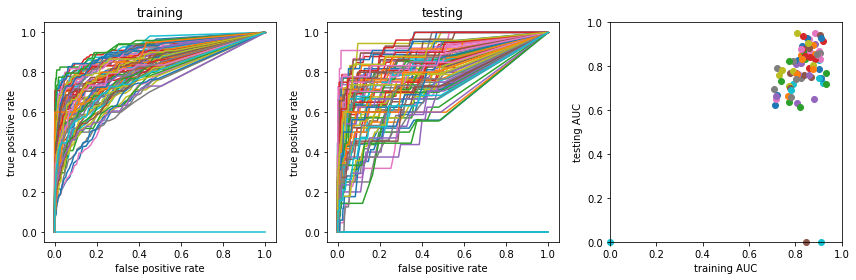
In [10]:
fig, ax = plt.subplots(1, 3, figsize=(12, 4))

for o, i in object_index.iteritems():

    mean, std = confidence[i].mean(), confidence[i].std()

    train_true = confidence[i, t_train2] > mean + 3*std
    test_true = confidence[i, t_test2] > mean + 3*std

    train_fpr, train_tpr, train_auc = roc(train_true, train_prediction[i])
    test_fpr, test_tpr, test_auc = roc(test_true, test_prediction[i])

    ax[0].plot(train_fpr, train_tpr)
    ax[1].plot(test_fpr, test_tpr)
    ax[2].scatter(train_auc, test_auc, clip_on=False)

ax[0].set_title('training')
ax[1].set_title('testing')
for a in ax[:2]:
    a.set_ylabel('true positive rate')
    a.set_xlabel('false positive rate')
ax[2].set_xlim(0, 1)
ax[2].set_ylim(0, 1)
ax[2].set_xlabel('training AUC')
ax[2].set_ylabel('testing AUC')

plt.tight_layout()
plt.show()

plt.close()
In [ ]: